
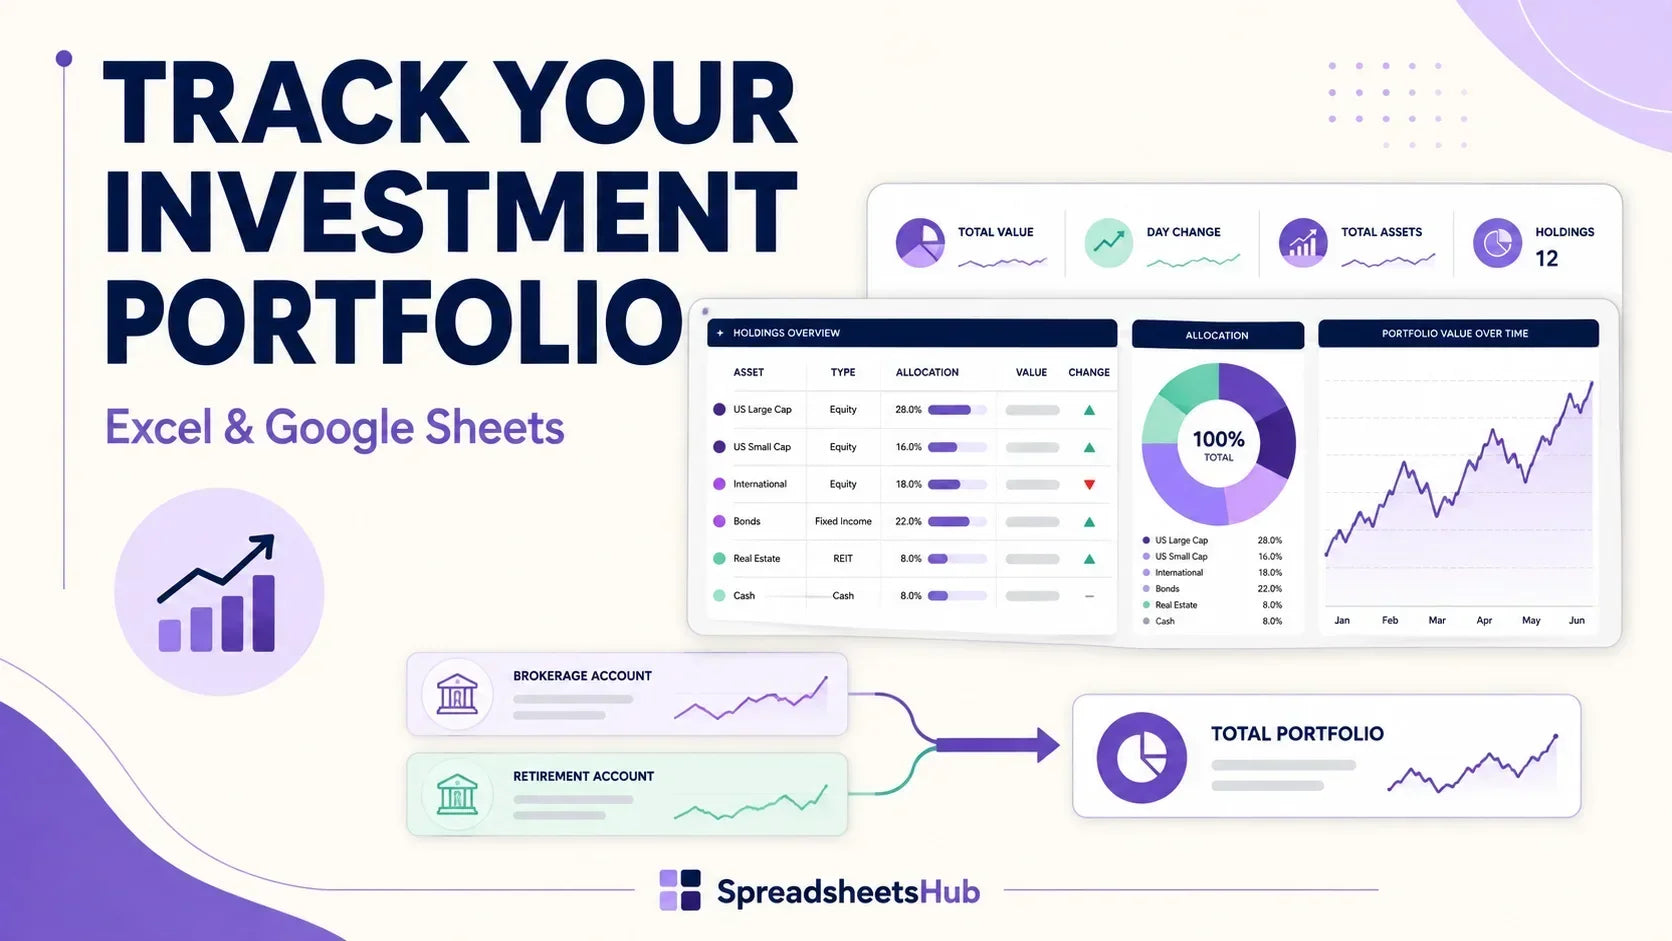
INVESTMENT TRACKING • PRACTICAL GUIDE
How to Track Your Investment Portfolio in Excel
One brokerage account shows one piece of the picture. A portfolio spreadsheet brings your holdings, cash and contributions together—so you can see what you own and distinguish money you added from money your investments earned.
This guide builds a simple tracking system for long-only stocks, ETFs and cash in Excel or Google Sheets. You will set up five tabs, record transactions consistently, calculate portfolio value and check a worked example. No macros or broker passwords are needed.
1. Define what your investment portfolio includes
List the accounts you want to measure together. For example, you might include two brokerage accounts and a retirement account, but exclude your household checking account. Give each included account a short, consistent label such as Broker A, Broker B or Retirement.
This boundary matters. Moving $500 from checking into Broker A is a contribution to this portfolio. Moving $500 from Broker A to Broker B is an internal transfer: your combined portfolio has not received new money.
Choose a starting date and reporting currency. Copy opening share quantities and cash balances from statements dated at that point. If you begin tracking an existing portfolio, record its starting market value separately from its historical purchase cost. They serve different purposes.
2. Build five tabs before building a dashboard
| Tab | What to store | Why it matters |
|---|---|---|
| Settings | Account names, base currency, asset categories, start date | Stops inconsistent labels from splitting your totals |
| Transactions | One row per event, including fees and cash movements | Provides an audit trail you can reconcile to statements |
| Holdings | Current units, prices, currency conversion and market values | Shows what you own today |
| Cash Flows | External contributions and withdrawals, with dates | Separates saving activity from investment performance |
| Monthly Review | Month-end values, cash, allocation and reconciliation notes | Preserves historical snapshots when live prices change |
Keep original broker exports in a separate archive. Use dropdowns for Account and Transaction Type, and protect formula columns against accidental edits. Do not mix a formula with manually entered totals in the same column.
The workflow works in either spreadsheet application. If you are choosing a platform, see our Excel vs. Google Sheets comparison. Start with manual statement prices if that makes your first version easier to verify.
3. Record transactions without double-counting cash
Use these columns: Date, Account, Type, Asset, Currency, Units, Unit Price, Gross Amount, Fee, Cash Change, Transfer ID and Notes. Keep amounts numeric; put currency codes in their own field.
A useful sign convention is positive units for purchases and negative units for sales. Cash Change is positive when account cash increases and negative when it decreases. Fees are entered as positive expenses and subtracted once.
| Event | Units change | Cash change | External flow? |
|---|---|---|---|
| Buy 10 shares at $50, $1 fee | +10 | −$501 | No |
| Sell 4 shares at $55, $1 fee | −4 | +$219 | No |
| Receive a $20 cash dividend | 0 | +$20 | No, while retained inside the portfolio |
| Deposit $500 from checking | 0 | +$500 | Yes: contribution |
| Withdraw $100 to checking | 0 | −$100 | Yes: withdrawal |
| Transfer $300 between included brokers | 0 | −$300 in A; +$300 in B | No at combined-portfolio level |
Dividends and reinvestment
Record a reinvested dividend as two linked events: dividend cash received, then shares purchased with that cash. The purchase increases units; it is not a new contribution from you. If the dividend is paid out to an excluded bank account, record the income and the matching external withdrawal.
Where tax is withheld, keep gross dividend and withholding separately, with net cash matching the statement. This is recordkeeping, not a substitute for a tax calculation.
Transfers between accounts
Give both sides the same Transfer ID and confirm the amounts balance. For in-kind security transfers, move the units between accounts without inventing a sale. Preserve acquisition and cost-basis records. A transfer from an account outside your chosen tracking boundary is different: it brings value into the tracked portfolio.
4. Calculate holdings and total portfolio value
Keep one Holdings row for each account-and-asset combination. Opening units plus signed transaction units gives current quantity. Reconcile that quantity before trusting the valuation.
For a minimal Holdings sheet, use A: Asset, B: Account, C: Units, D: Price, E: FX to Base and F: Market Value. Enter the exchange rate as units of base currency per unit of the asset currency; use 1 when both currencies match.
F2 = C2*D2*E2For example, 10 shares × €50 × 1.10 USD per EUR = $550. These are illustrative inputs, not current exchange rates. Multiply each holding by its own conversion rate before adding values together.
Total portfolio value = SUM(holdings market values) + cash in base currencyInclude uninvested brokerage cash exactly once. If you represent cash as a Holdings row, do not add it again as a separate balance. Use the same valuation date across accounts and flag prices that are missing or stale.
What about automatic stock prices?
In Google Sheets, a supported exchange-qualified symbol can be used with =GOOGLEFINANCE("NASDAQ:MSFT","price"). This symbol is only a syntax example, not a recommendation. Google notes that quotes can be delayed by up to 20 minutes and coverage is limited; see the GOOGLEFINANCE documentation. For a complete Google Sheets build with a transactions tab, average cost and realized gains, see our stock portfolio tracker in Google Sheets guide.
Do not turn missing quotes into zero with a blanket error handler: that can make an investment appear worthless and distort allocation. Display “Check price” and reconcile against the broker instead. For month-end history, save a dated snapshot rather than relying on formulas that keep refreshing.
5. Separate investment gain from contributions
For a period with consistent portfolio boundaries, use:
Contributions and withdrawals here mean external flows only, entered as positive totals. The result is a currency amount, not an annualized percentage return. Because account values already reflect retained dividends, fees and investment changes, do not add retained dividends again or subtract those fees twice.
A simple percentage change in account balance is misleading when money enters or leaves during the period. Dividing the gain by all contributions is also not a timing-aware return measure.
When to use XIRR
For a personal, money-weighted annualized return, create a separate dated cash-flow schedule. Enter starting market value and later external contributions as negative values, withdrawals as positive values, and ending market value as a positive terminal value. Internal purchases and retained dividends are not extra external cash flows.
=XIRR(B2:B5,A2:A5)Here column A contains actual spreadsheet dates and column B signed amounts. Microsoft’s XIRR reference explains the syntax and error conditions. At least one negative and one positive amount are required. XIRR can fail to converge; unusual cash-flow patterns may produce ambiguous results. Do not replace an error with a claimed 0% return.
Worked example: a bigger balance is not all profit
Suppose two accounts have a combined starting value of $10,000. You contribute $2,000 and withdraw $500 during the month. At month-end, holdings and cash total $12,100.
The calculation is $12,100 − $10,000 − $2,000 + $500 = $600. If $100 of dividends remains in account cash, it is already part of the $12,100. Adding it again would overstate the gain.
6. Review your portfolio monthly
A small spreadsheet that matches your statements is more useful than a sophisticated dashboard built on missing transactions. Use a repeatable closing routine:
- Reconcile units. Match each holding to its broker statement; investigate splits, missing purchases and duplicate imports.
- Reconcile cash. Check dividends, interest, fees, withdrawals and unsettled activity against the same reporting convention.
- Match transfers. Confirm both sides exist and exclude internal movements from consolidated contributions.
- Check valuations. Record date, price source and FX rate; flag unavailable quotes.
- Review allocation. Divide each asset class’s market value by total portfolio value. Use underlying exposure: an equity ETF is not a separate asset class simply because it is an ETF.
- Save a snapshot. Store the month-end totals as dated values, then note one issue to resolve.
Allocation drift is a prompt to review your plan, not an automatic trading signal. Before rebalancing, consider costs, taxes and your own objectives; the Investor.gov allocation guide explains these trade-offs.
Portfolio tracker or trading journal?
A portfolio tracker answers “What do I own, and how has the whole account changed?” A trading journal answers “Why did I take this trade, what risk did I plan, and did I follow my process?” If you actively trade part of your portfolio, use our Excel trading journal setup guide for that separate decision log. Explore the trading journal templates if you need a ready-made version.
Prefer a ready-made investment portfolio tracker?
You can build the structure above yourself. If you would rather begin with an existing workbook, compare our investment portfolio tracking templates and choose by the assets you actually hold—not by the number of dashboard charts.

For individual stock holdings
The Stock Portfolio Tracker includes purchase and sale tracking, fees, dividend records and profit/loss calculations. The Watchlist is available in Google Sheets only, not the Excel version.
View Stock Portfolio Tracker
For ETFs and index funds
The ETF & Index Fund Tracker focuses on fund portfolios, account transactions, allocation analysis and dividend tracking. Review the product examples and requirements before choosing it.
View ETF & Index Fund TrackerThese product pages specify Microsoft 365 for the Excel files, or a Google account for Google Sheets. Features may differ between versions. The DIY example above is not a claim that every template uses exactly the same structure or calculations.
Investment portfolio spreadsheet FAQ
Can I track more than one brokerage account in Excel?
Yes. Keep an Account field on every transaction and holding, then summarize by account and across the combined portfolio. Define which accounts are inside your tracking boundary so internal transfers are not mistaken for fresh contributions.
Should I include cash in my portfolio value?
Include cash held inside the accounts you are tracking. Exclude unrelated spending accounts unless you deliberately include them in the portfolio boundary. Count each cash balance only once.
Are dividends contributions?
No. A dividend is investment income, not new money you contributed. If it remains inside the portfolio, it is already reflected in cash or reinvested holdings. A payout outside the portfolio is also recorded as an external withdrawal.
How do I calculate return when I add money regularly?
First calculate gain in currency units using ending value minus starting value minus contributions plus withdrawals. For a timing-aware, annualized money-weighted return, use a dated external cash-flow schedule with XIRR. These are different measures.
Can I use Google Sheets instead?
Yes. The basic tab structure and arithmetic work in both applications. Quote coverage, refresh behavior and template features can differ. Always keep a way to enter and verify statement values manually.
Is this spreadsheet enough for taxes?
No. Portfolio tracking helps organize information, but taxable gains depend on jurisdiction, account type, cost-basis methods and other rules. Preserve broker tax documents and consult a qualified professional where needed.


